Attabotics technology enters new era as part of LaFayette Systems

Innovative goods-to-person cube storage technology now part of family-owned group of businesses with over 30 years of material handling and warehouse automation experience

  • New ownership provides stable financial foundation, engineering and domain expertise to enhance customer support, advance technology development and commercialization
  • Leadership team combines mix of legacy Attabotics staff and material handling industry veterans
  • As part of LaFayette Systems, Attabotics gains access to footprint and resources throughout the United States
  • Existing Attabotics location at 10th St NE in Calgary to continue operation

CALGARY, Alberta, Canada. (Feb. 10, 2026) –Attabotics, a provider of robotic cube storage solutions for goods-to-person warehouse applications, announces it will restart operations as part of LaFayette Systems. LaFayette is a privately owned, closely held organization with a decades-long reputation as a trusted partner in material handling automation. The company acquired Attabotics in September 2025, establishing a strong foundation to further develop, deploy and support Attabotics’ patented technologies.

“As we begin this new chapter, our goal is simple: pair the exceptional technology from Attabotics with LaFayette’s warehouse automation expertise and customer-first culture,” says Bruce Robbins, who founded LaFayette in 1989. “We believe that combination brings the right focus and discipline to the technology and allows us to deliver reliable, long-term value for our customers.”

The existing Attabotics facility in Calgary will continue to house key engineering, business and manufacturing functions. The new Attabotics leadership team is a deliberate balance of deep institutional knowledge and fresh perspectives. Legacy team members Mark Dickinson, John Hickman and Derek Fortier remain with the organization, with Dickinson leading overall strategy and operations, Hickman heading manufacturing and Fortier overseeing supply chain management. Several veteran Attabotics engineers also remain on staff, preserving specialized technical expertise. Joining the team to lead sales and software is Art Eldred, who brings over 30 years of material handling experience at Vargo, Dematic and Intelligrated.

“Attabotics was built on innovative technology and strong engineering, and now as part of LaFayette Systems, we have the support to fully realize its potential,” says Mark Dickinson, Senior Vice President and General Manager, and part of the Attabotics team since 2020. “We’re focused on accelerating development, improving reliability and listening to what matters to customers, so that we can meet demand for technology that simplifies complex fulfillment operations.”

LaFayette Systems maintains a coast-to-coast U.S. presence through its family of companies, including: LaFayette Engineering, which specializes in conveyor and sortation software and controls; Mesh Automation,, a provider of industrial robotics and machine vision solutions; Century Conveyor Systems, which focuses on the northeast U.S. to provide conveyor system design and integration, installation and on-site maintenance services; and Kendale Industries, a custom metal fabricator focused on material handling components and accessories.

Across the entire LaFayette organization, the core mission is to serve as a true customer advocate. That includes immediate problem solving as soon as an issue arises and providing the transparency to recommend alternative solutions – even when the best path forward lies outside the group’s own portfolio. This commitment extends to Attabotics, and each employee signs a pledge to uphold these values.

For more information, visit Attabotics in booth C14787 at the upcoming MODEX trade show in Atlanta, April 13-16.

To access an image, click here.

About Lafayette Systems

Headquartered in Danville, Kentucky, LaFayette Systems combines a family of material handling companies with varying specialties that together design, build and integrate conveyor, sortation and robotics systems for global brands.

About Attabotics

Attabotics debuted as the world’s first robotics goods-to-person cubic storage and retrieval system in 2016, offering a space-efficient and high-speed alternative to traditional warehouse fulfillment. The innovative Attabotics technology replaces the rows and aisles of traditional fulfillment centers with a patented storage structure and robotic shuttles that utilize both horizontal and vertical space to significantly reduce warehouse space requirements and provide direct access to any location with only value-added moves.

About LaFayette Engineering

Founded in 1989, LaFayette Engineering started in Danville, Kentucky as a controls company providing automation systems for manufacturers and system integrators. LaFayette Engineering has evolved to provide complete systems integration, warehouse control software, SCADA diagnostics systems, project management, installation and 24/7 support. The beginning focus to put our customer’s interest first and listen to their needs and concerns has stayed as our primary focus.

Media contact:
Dan Gauss
Koroberi
336.409.5391
dan@koroberi.com

Nobody Does Warehouse Logistics Like LaFayette Engineering in 2025

Introduction: A New Standard for Modern Warehouses

As supply chains grow more complex and customer expectations rise, warehouses are under increasing pressure to operate faster, smarter, and more efficiently. In 2025, success depends on more than square footage and shelving—it requires intelligent systems, optimized workflows, and forward-thinking engineering.

LaFayette Engineering has emerged as a leader in warehouse logistics, helping organizations design and implement facilities that keep goods moving efficiently while reducing costs and bottlenecks. With a focus on performance, scalability, and long-term value, LaFayette Engineering continues to set itself apart in an increasingly competitive landscape.


Why Warehouse Logistics Matter More in 2025

Modern warehouses are no longer static storage spaces. They are dynamic hubs that support e-commerce, manufacturing, and global distribution. Poorly designed layouts or outdated processes can slow operations, increase labor costs, and limit growth.

Effective warehouse logistics focuses on:

  • Streamlined material flow
  • Efficient use of space
  • Reduced handling time
  • Improved accuracy and safety

In 2025, companies that invest in smarter logistics infrastructure gain a clear operational advantage.


LaFayette Engineering’s Approach to Warehouse Logistics

Engineering-Driven Solutions

LaFayette Engineering approaches warehouse projects with an engineering-first mindset. Every system is designed around data, process flow, and real-world operational needs—not generic templates.

By analyzing throughput requirements, inventory profiles, and labor patterns, LaFayette Engineering creates logistics solutions that improve efficiency from day one.

Designed for Today—and Tomorrow

Scalability is a core principle. Facilities designed by LaFayette Engineering are built to adapt to changing volumes, new technologies, and evolving business models.


What Sets LaFayette Engineering Apart in 2025

1. Intelligent Facility Design

Layout matters. LaFayette Engineering designs warehouses that minimize travel time, reduce congestion, and improve picking and replenishment efficiency.

2. Automation Integration Expertise

Automation plays a growing role in warehouse operations. LaFayette Engineering seamlessly integrates conveyors, sortation systems, robotics, and automated storage solutions into cohesive systems.

3. Process Optimization

Beyond equipment, LaFayette Engineering focuses on how people, systems, and materials interact. Optimized workflows lead to faster order fulfillment and fewer errors.

4. Space Utilization Strategies

Efficient use of vertical and horizontal space allows organizations to increase capacity without expanding their footprint—an essential advantage in high-demand markets.

5. Data-Informed Decision Making

Design decisions are backed by operational data and performance modeling. This ensures systems are right-sized and aligned with actual demand.

6. Safety-Focused Engineering

Well-designed logistics systems reduce accidents and strain on workers. Safety is built into layouts, equipment selection, and traffic flow planning.

7. Industry-Specific Solutions

Different industries have different logistics challenges. LaFayette Engineering tailors solutions for manufacturing, distribution, cold storage, and specialized facilities.

8. Seamless System Integration

Warehouse logistics don’t operate in isolation. LaFayette Engineering ensures systems integrate smoothly with upstream and downstream operations.

9. Reduced Operating Costs

Efficient layouts, automation, and process improvements help reduce labor costs, energy usage, and operational waste.

10. Long-Term Performance and Reliability

Systems are engineered for durability and consistent performance, helping organizations avoid frequent retrofits or disruptions.


Who Benefits Most from LaFayette Engineering’s Expertise?

LaFayette Engineering works with organizations that:

  • Manage high-volume distribution
  • Require fast, accurate order fulfillment
  • Are scaling operations or modernizing facilities
  • Need customized logistics solutions

For these businesses, strong warehouse logistics are not optional—they are mission-critical.


Frequently Asked Questions (FAQs)

1. What does warehouse logistics include?

It includes facility layout, material flow, automation, storage systems, and process design.

2. Can LaFayette Engineering modernize existing warehouses?

Yes. They can redesign workflows and integrate new systems into existing facilities.

3. Is automation always necessary?

Not always, but automation can significantly improve speed, accuracy, and scalability when applied correctly.

4. How does good design improve efficiency?

Better layouts reduce travel time, congestion, and unnecessary handling.

5. Does LaFayette Engineering support future expansion?

Yes. Scalability is a key part of their design philosophy.

6. What industries does LaFayette Engineering serve?

They support manufacturing, distribution, and specialized warehouse operations.


Conclusion: The Future of Warehouse Logistics Is Here

Warehouse Logistics

In 2025, warehouse success depends on intelligent design, efficient workflows, and systems that evolve with the business. LaFayette Engineering delivers all three—setting a new benchmark for performance-driven logistics solutions.

When it comes to warehouse logistics, nobody does it like LaFayette Engineering. Their engineering expertise, forward-thinking approach, and commitment to long-term value make them the partner of choice for modern warehouses looking to stay ahead.

Want to start a partnership with LaFayette Engineering today? Click here to get started.

LaFayette Engineering Can Help You Reach 100% Operational Efficiency

Why Efficiency Matters in Modern Operations

In today’s industrial and infrastructure-driven environments, organizations are expected to do more with less. Rising costs, tighter timelines, and increased performance expectations mean that inefficiencies can quickly impact profitability and reliability. Improving operational efficiency allows companies to reduce waste, increase output, and maintain consistent performance without unnecessary expense.

LaFayette Engineering helps clients address these challenges by designing and optimizing systems that support long-term performance, reliability, and growth.


Defining Operational Efficiency in Practical Terms

Operational efficiency refers to how effectively an organization uses its resources—people, equipment, energy, and time—to achieve desired outcomes. It is influenced by factors such as:

  • System and facility design
  • Workflow and process alignment
  • Equipment reliability
  • Energy and resource usage
  • Maintenance strategies

When these elements work together effectively, organizations experience smoother operations, fewer disruptions, and stronger overall performance.


How LaFayette Engineering Supports Better Performance

LaFayette Engineering takes a practical, engineering-first approach to improving how systems operate in real-world conditions. Rather than focusing on theory alone, the team evaluates how facilities actually function day to day.

Smart System Design

Good design decisions reduce complexity and eliminate unnecessary steps. LaFayette Engineering focuses on layouts, equipment selection, and system integration that support efficient workflows and long-term reliability. Thoughtful design plays a major role in achieving higher operational efficiency over the life of a facility.


Process Review and Optimization

Even well-established operations often contain hidden inefficiencies. Through detailed analysis, LaFayette Engineering identifies bottlenecks, redundancies, and process gaps that limit productivity. Addressing these issues improves throughput and consistency without requiring major operational disruption.


Reliability and Downtime Reduction

Unexpected downtime is one of the most common barriers to strong performance. LaFayette Engineering helps clients design systems that are easier to maintain and less prone to failure. Improved reliability supports consistent output and contributes directly to improved operational efficiency.


Energy and Resource Management

Energy and material use are significant cost drivers in most operations. By improving system performance and eliminating waste, LaFayette Engineering helps organizations reduce consumption while maintaining production goals. Smarter resource use strengthens overall efficiency and supports sustainability initiatives.


Solutions Designed for Long-Term Growth

Operational needs evolve over time. LaFayette Engineering designs systems that can adapt to increased demand, new processes, or future expansion. Flexible solutions help protect performance and maintain operational efficiency as organizations grow.


Key Benefits of Improving Efficiency

Organizations that focus on improving how their systems operate experience benefits that extend well beyond cost savings, including:

  • Lower operating and maintenance expenses
  • Improved safety and regulatory compliance
  • More consistent production outcomes
  • Better use of labor and equipment
  • Stronger long-term competitiveness

These advantages contribute to more resilient and dependable operations.


Industries Served by LaFayette Engineering

LaFayette Engineering works with clients across manufacturing, infrastructure, energy, and industrial processing sectors. In each case, the objective is the same: design and optimize systems that perform reliably under real operating conditions.

By aligning engineering solutions with operational realities, LaFayette Engineering helps clients achieve meaningful and measurable improvements in operational efficiency.


Frequently Asked Questions

1. What limits efficiency most in industrial operations?

Poor system design, downtime, and misaligned processes are common factors.

2. Can efficiency improvements be made without major upgrades?

Yes. Many improvements come from optimizing existing systems.

3. How does engineering design affect performance?

Good design reduces complexity, improves reliability, and supports smoother workflows.

4. Is efficiency improvement a one-time effort?

No. It is an ongoing process supported by smart system design.

5. Does efficiency improvement also enhance safety?

Yes. Well-designed systems reduce risk and improve control.

6. How quickly can results be seen?

Some improvements are immediate, while others deliver value over time.


Conclusion: Turning Engineering Expertise Into Better Results

Operational Efficiency

Achieving peak performance requires more than short-term fixes—it requires systems designed to operate efficiently over the long term. By focusing on smart design, process optimization, and reliability, LaFayette Engineering helps organizations move closer to their goals and sustain strong operational efficiency.

With a practical approach and deep engineering expertise, LaFayette Engineering delivers solutions that help clients operate smarter, safer, and more effectively every day.

Want to experience that efficiency for yourself? Contact LaFayette Engineering here to get started.

Why Lafayette Engineering Should Be Your Industrial Operations Partner in 2026

Introduction: Industrial Operations Demand the Right Partner

Industrial environments are becoming more complex, data-driven, and performance-focused than ever before. In 2026, organizations are under pressure to increase throughput, reduce downtime, manage labor challenges, and operate more efficiently—all while maintaining safety and reliability. Meeting these demands requires more than equipment upgrades; it requires a trusted partner who understands the full scope of modern industrial operations.

That partner is LaFayette Engineering. With a strong foundation in engineering, controls, and system integration, LaFayette Engineering helps industrial facilities operate smarter, faster, and more reliably.


What Industrial Operations Look Like in 2026

Industrial operations today extend far beyond basic production. They encompass interconnected systems that must work together seamlessly, including:

  • Automated equipment and machinery
  • Control systems and industrial networks
  • Data collection and performance monitoring
  • Material handling and logistics
  • Safety and compliance systems

In this environment, inefficiencies in one area can ripple across the entire operation. LaFayette Engineering focuses on aligning systems so operations perform as a unified whole.


Engineering-Driven Solutions Built for Real-World Performance

At the core of LaFayette Engineering’s value is an engineering-first mindset. Rather than applying generic solutions, each project begins with a detailed analysis of existing processes, constraints, and goals.

This approach allows LaFayette Engineering to design solutions that:

  • Address real operational bottlenecks
  • Improve system reliability
  • Reduce unnecessary complexity
  • Deliver measurable performance gains

Engineering precision is essential for sustainable improvements in industrial operations.


Automation Expertise That Improves Productivity

Automation is a key driver of efficiency in modern facilities. LaFayette Engineering designs and integrates automation systems that help industrial operations:

  • Increase throughput and consistency
  • Reduce manual errors
  • Improve equipment utilization
  • Enhance worker safety

By aligning automation with operational objectives, systems deliver value without disrupting established workflows.


System Integration That Eliminates Silos

Disconnected systems are a common source of inefficiency. LaFayette Engineering specializes in integrating equipment, controls, and software so data and commands flow seamlessly across operations.

Integrated systems improve:

  • Real-time visibility
  • Decision-making speed
  • Coordination between processes
  • Overall operational stability

This connectivity is critical for optimizing industrial operations in 2026.


Data-Driven Insights for Smarter Operations

Modern industrial systems generate vast amounts of data. LaFayette Engineering helps facilities turn that data into actionable insights by implementing:

  • Performance dashboards
  • Trend analysis tools
  • Diagnostic and alert systems
  • Predictive maintenance strategies

Data-driven operations reduce downtime, improve planning, and support continuous improvement.


Reliability and Uptime as Design Priorities

Downtime remains one of the greatest risks to industrial performance. LaFayette Engineering designs systems with reliability in mind by focusing on:

  • Robust system architectures
  • Clear fault detection and diagnostics
  • Maintainable control designs
  • Thorough testing and commissioning

These practices help industrial operations maintain consistent output and minimize disruptions.


Scalable Solutions for Evolving Facilities

Industrial facilities rarely remain static. Growth, new product lines, and changing demand require systems that can adapt. LaFayette Engineering designs scalable solutions that support:

  • Capacity expansion
  • New equipment integration
  • Software upgrades
  • Future automation enhancements

Scalability ensures today’s investments continue delivering value tomorrow.


Industry Experience That Reduces Risk

Experience matters when working in complex environments. LaFayette Engineering brings hands-on experience across manufacturing, warehousing, and automated systems. This practical knowledge allows teams to anticipate challenges and avoid common pitfalls.

Their familiarity with industrial operations ensures solutions work not just in theory, but on the plant floor.


Clear Communication and Disciplined Project Execution

Successful partnerships depend on communication. LaFayette Engineering emphasizes:

  • Clearly defined project scopes
  • Transparent timelines and expectations
  • Regular progress updates
  • Close coordination with internal teams and vendors

This disciplined execution keeps projects aligned with operational goals and schedules.


Long-Term Partnership Beyond Project Completion

LaFayette Engineering views each engagement as the start of a long-term relationship. Ongoing support includes:

  • System optimization
  • Troubleshooting and upgrades
  • Operational consulting
  • Continuous improvement planning

This long-term involvement helps industrial operations remain efficient as technology and demands evolve.


Why 2026 Is the Right Time to Choose the Right Partner

With rising costs, tighter labor markets, and increasing competition, industrial operations must be smarter and more efficient than ever. Organizations that invest in engineered, integrated solutions today are better positioned to remain competitive in 2026 and beyond.

LaFayette Engineering helps facilities take proactive steps toward operational excellence rather than reactive fixes.


FAQs About Industrial Operations and LaFayette Engineering

Q1: What are industrial operations?
They include the systems, processes, and technologies used to run manufacturing, warehousing, and industrial facilities efficiently.

Q2: How does LaFayette Engineering improve industrial operations?
Through engineering-driven design, automation, system integration, and data-driven optimization.

Q3: Can existing systems be upgraded instead of replaced?
Yes. LaFayette Engineering specializes in improving and integrating existing infrastructure.

Q4: Does automation reduce workforce needs?
Automation improves productivity and safety while allowing workers to focus on higher-value tasks.

Q5: Are solutions scalable for future growth?
Yes. Systems are designed to adapt to changing operational requirements.

Q6: Does LaFayette Engineering provide long-term support?
Yes. Ongoing optimization and support are key parts of their service approach.


Conclusion

Industrial Operations

In 2026, successful industrial operations depend on smart engineering, reliable systems, and adaptable technology. LaFayette Engineering delivers these essentials through an engineering-driven approach that improves performance, reduces risk, and supports long-term growth.

For organizations seeking a trusted industrial operations partner who understands both technology and real-world demands, LaFayette Engineering offers the expertise needed to operate with confidence—today and into the future.

Want to begin your partnership? Contact Lafayette engineering here to get started.

Achieve Maximum Efficiency with LaFayette Engineering in 2026

Conveyor system integration

Introduction: Efficiency as a Competitive Advantage in 2026

In 2026, efficiency is no longer just an operational goal—it is a competitive requirement. Facilities that move faster, waste less, and operate reliably are the ones that stay ahead. Achieving maximum efficiency requires more than upgraded equipment; it demands thoughtful engineering, intelligent integration, and a deep understanding of real-world operations.

This is where LaFayette Engineering stands apart. Through disciplined engineering practices and hands-on execution, LaFayette Engineering helps organizations streamline operations, reduce downtime, and unlock measurable performance gains.


What Maximum Efficiency Really Means

Maximum efficiency is not about cutting corners or rushing projects. It is about designing systems that deliver the highest possible output with the least amount of waste, delay, and risk. In practical terms, this includes:

  • Optimized workflows and material movement
  • Reduced energy and resource consumption
  • Reliable system uptime
  • Scalable designs that support growth
  • Simplified maintenance and troubleshooting

LaFayette Engineering approaches efficiency as a system-wide objective rather than a single improvement.


Engineering-Driven Solutions Built for Performance

At the core of LaFayette Engineering’s approach is engineering precision. Every project begins with a detailed analysis of existing processes, equipment, and constraints. Engineers focus on:

  • Identifying bottlenecks and inefficiencies
  • Mapping data and control flows
  • Evaluating system interactions
  • Designing solutions that improve overall performance

This methodical approach ensures efficiency gains are real, sustainable, and measurable.


Automation That Improves Throughput and Reliability

Automation plays a critical role in achieving maximum efficiency. LaFayette Engineering designs and integrates automation systems that help facilities:

  • Increase throughput
  • Improve accuracy and consistency
  • Reduce manual intervention
  • Enhance system reliability

By aligning automation with operational goals, LaFayette Engineering ensures technology supports productivity rather than adding complexity.


Smart System Integration Across Operations

Disconnected systems create inefficiencies. LaFayette Engineering specializes in integrating equipment, controls, and software so they function as a unified system.

This integration improves:

  • Communication between machines
  • Real-time decision-making
  • Operational visibility
  • Response time to issues

Well-integrated systems are essential to maintaining efficient, high-performing operations.


Data-Driven Insights for Continuous Improvement

Modern facilities generate vast amounts of data. LaFayette Engineering helps clients leverage that data to drive efficiency improvements through:

  • Performance monitoring
  • Trend analysis
  • Predictive diagnostics
  • Informed decision-making

Using data effectively allows organizations to identify inefficiencies early and make targeted improvements.


Reducing Downtime Through Reliable Design

Unplanned downtime is one of the biggest barriers to efficiency. LaFayette Engineering designs systems with reliability in mind by incorporating:

  • Redundancy where appropriate
  • Clear fault detection and diagnostics
  • Maintainable system architectures
  • Robust testing and commissioning

These practices reduce disruptions and support consistent operational performance.


Scalable Solutions That Support Future Growth

Efficiency today must not limit tomorrow. LaFayette Engineering designs solutions that can scale with changing demands, allowing facilities to:

  • Expand capacity
  • Integrate new equipment
  • Adopt new technologies
  • Adjust to evolving production requirements

This forward-looking approach protects investments while supporting long-term efficiency.


Industry Experience That Translates into Results

Experience across industrial environments allows LaFayette Engineering to apply proven strategies rather than theoretical solutions. Their understanding of manufacturing, warehousing, and automated systems helps ensure efficiency improvements work in real operating conditions.

This practical insight is essential to achieving maximum efficiency without introducing unnecessary risk.


Clear Communication and Project Execution

Efficiency is lost when projects stall or misunderstandings occur. LaFayette Engineering prioritizes:

  • Clear project scope definition
  • Transparent timelines
  • Consistent stakeholder communication
  • Coordinated execution

Strong project management keeps efficiency goals intact from concept through completion.


Long-Term Support That Sustains Efficiency

Achieving maximum efficiency is not a one-time event. LaFayette Engineering supports ongoing performance through:

  • System optimization
  • Troubleshooting and upgrades
  • Operational consulting
  • Continuous improvement planning

This long-term partnership ensures efficiency gains are maintained as operations evolve.


Why 2026 Is the Right Time to Focus on Efficiency

With rising operational costs, tighter labor markets, and increasing competition, efficiency has never been more critical. Organizations that invest in engineered solutions today are better positioned to remain agile and competitive in 2026 and beyond.

LaFayette Engineering helps clients take proactive steps toward smarter, more efficient operations.


FAQs About Maximum Efficiency and LaFayette Engineering

Q1: What does maximum efficiency mean for industrial operations?
It means optimizing systems to deliver the highest output with minimal waste, downtime, and cost.

Q2: Does automation always improve efficiency?
When properly designed and integrated, automation significantly improves reliability and throughput.

Q3: Can existing systems be upgraded for better efficiency?
Yes. LaFayette Engineering specializes in improving and integrating existing systems.

Q4: How does data improve efficiency?
Data reveals trends, inefficiencies, and opportunities for targeted improvements.

Q5: Are efficient systems harder to maintain?
No. Well-designed systems are often easier to maintain and troubleshoot.

Q6: Does LaFayette Engineering provide long-term support?
Yes. Ongoing optimization and support are key parts of their service model.


Conclusion

Maximum Efficiency

Achieving maximum efficiency in 2026 requires more than isolated upgrades—it requires a comprehensive, engineering-driven approach to operations. LaFayette Engineering delivers this through smart automation, system integration, data-driven insights, and reliable execution.

For organizations seeking to improve performance, reduce waste, and stay competitive, LaFayette Engineering provides the expertise and solutions needed to operate at peak efficiency—now and into the future.

Want to start today? Contact LaFayette here to get started.

Lafayette Engineering is the #1 Best Choice for WCS Installation in Central Kentucky. Here’s Why.

Introduction: Why WCS Installation Matters More Than Ever

Modern warehouses are no longer just storage spaces—they are highly automated, data-driven environments where efficiency, accuracy, and uptime directly affect profitability. At the center of this transformation is the warehouse control system (WCS), which coordinates automation, material handling equipment, and real-time operations on the warehouse floor.

For companies in Central Kentucky, choosing the right partner for WCS installation is critical. Lafayette Engineering Inc has emerged as the #1 choice by delivering dependable systems, seamless integration, and long-term operational value.


What Is a Warehouse Control System (WCS)?

A warehouse control system acts as the operational brain between higher-level software (such as WMS or ERP systems) and physical automation equipment. A properly implemented WCS:

  • Controls conveyors, sorters, and AS/RS systems
  • Manages real-time equipment communication
  • Optimizes material flow and throughput
  • Reduces downtime and operational errors
  • Improves visibility across warehouse operations

Because of this central role, WCS installation requires precision, planning, and deep technical expertise.


Why Lafayette Engineering Is the Trusted Leader in Central Kentucky

Lafayette Engineering has built its reputation by delivering industrial automation solutions that work reliably in real-world conditions. Their experience with complex control systems makes them uniquely qualified to handle WCS installation projects of varying size and complexity.

Their success is rooted in engineering discipline, hands-on experience, and a strong understanding of warehouse operations.


1. Proven Expertise in Industrial Controls and Automation

WCS installation demands a deep understanding of PLCs, HMIs, industrial networks, and material handling systems. Lafayette Engineering brings extensive experience in:

  • Industrial control system design
  • PLC programming and integration
  • HMI development
  • Network architecture for automation
  • System commissioning and validation

This technical foundation ensures every WCS is installed correctly and performs as intended.


2. Engineering-Driven Approach to WCS Installation

Rather than using one-size-fits-all solutions, Lafayette Engineering applies an engineering-first methodology. Each WCS installation begins with:

  • Detailed system analysis
  • Equipment and process mapping
  • Communication and data flow planning
  • Failure mode and redundancy considerations

This structured planning minimizes risk and improves system reliability.


3. Seamless Integration with Warehouse Automation Equipment

A WCS must communicate flawlessly with automation assets. Lafayette Engineering has experience integrating systems with:

  • Conveyor and sortation systems
  • Automated storage and retrieval systems (AS/RS)
  • Robotics and palletizing equipment
  • Scanners, sensors, and vision systems

Their integration expertise ensures smooth coordination between software and hardware.


4. Custom Solutions Built for Real-World Operations

No two warehouses operate exactly the same way. Lafayette Engineering customizes each WCS installation based on:

  • Facility layout
  • Throughput requirements
  • Order profiles
  • Growth and scalability needs

This customization ensures the system supports actual operational demands rather than forcing operations to adapt to the software.


5. Focus on Reliability and Uptime

Downtime is costly. Lafayette Engineering designs WCS installations with reliability as a top priority by incorporating:

  • Robust error handling
  • Redundant communication paths
  • Clear alarm and diagnostic logic
  • Easy-to-maintain system architecture

These design choices reduce downtime and simplify troubleshooting.


6. Experienced On-Site Installation and Commissioning

Proper installation is just as important as system design. Lafayette Engineering provides hands-on support during:

  • System installation
  • Equipment checkout
  • Functional testing
  • Live commissioning

Their on-site presence ensures issues are resolved quickly and systems go live smoothly.


7. Strong Understanding of Warehouse Operations

Successful WCS installation requires more than technical skill—it requires operational insight. Lafayette Engineering understands:

  • Material flow logic
  • Order fulfillment strategies
  • Peak demand challenges
  • Labor and automation interaction

This operational awareness allows them to design systems that improve efficiency without disrupting workflows.


8. Scalable Systems Designed for Future Growth

Warehouses evolve. Lafayette Engineering designs WCS installations that support:

  • Future automation expansion
  • Additional conveyor zones
  • Increased throughput
  • New software integrations

This future-ready mindset protects the customer’s investment over the long term.


9. Clear Communication and Project Coordination

Complex automation projects require clear coordination. Lafayette Engineering emphasizes:

  • Defined project scopes
  • Transparent timelines
  • Regular progress updates
  • Close collaboration with equipment vendors

This communication-focused approach keeps projects on schedule and aligned with expectations.


10. Long-Term Support Beyond Installation

A successful WCS installation doesn’t end at go-live. Lafayette Engineering provides ongoing support, including:

  • System optimization
  • Troubleshooting assistance
  • Updates and enhancements
  • Operational consulting

This long-term partnership ensures systems continue performing as operations evolve.


Why Central Kentucky Businesses Choose Lafayette Engineering

Central Kentucky’s distribution and manufacturing sectors demand reliability, speed, and precision. Lafayette Engineering’s ability to deliver dependable WCS installation solutions makes them the preferred partner for companies seeking operational excellence.

Their combination of engineering expertise, automation experience, and regional understanding sets them apart.


FAQs About WCS Installation and Lafayette Engineering

Q1: What does WCS installation involve?
It includes system design, integration, programming, testing, and commissioning of warehouse control software.

Q2: Can Lafayette Engineering integrate with existing warehouse systems?
Yes. They specialize in integrating WCS solutions with existing automation and software platforms.

Q3: Is WCS installation scalable for future growth?
Yes. Systems are designed to support expansion and increased throughput.

Q4: How long does a typical WCS installation take?
Timelines vary by complexity, but Lafayette Engineering plans projects to minimize operational disruption.

Q5: Do they provide on-site support?
Yes. On-site installation, commissioning, and troubleshooting are part of their service offering.

Q6: Why is Lafayette Engineering considered the best choice in Central Kentucky?
Their engineering-driven approach, automation expertise, and commitment to reliability set them apart.


Conclusion

WCS Installation

A warehouse control system is a mission-critical component of modern distribution operations. Choosing the right partner for WCS installation can mean the difference between smooth, efficient workflows and costly downtime. Lafayette Engineering Inc has proven itself as the #1 choice in Central Kentucky by delivering reliable systems, expert integration, and long-term support.

For organizations seeking dependable automation solutions built on engineering excellence, Lafayette Engineering remains the clear leader in WCS installation.

Interested in improving your warehouse? Contact Lafayette Engineering here for consultations and inquiries.

Predictive Maintenance for Conveyor Systems: A Practical, Data-Driven Playbook for Higher Uptime and Lower Cost

Reduce Warehouse Labor Costs

Predictive maintenance for conveyor systems is the fastest way to convert your line from “run to failure” chaos into a stable, measurable, and continuously improving operation—without overspending on blanket part swaps or intrusive shutdowns. In high-velocity fulfillment, the smartest maintenance program blends sensors, PLC/HMI telemetry, and disciplined workflows to anticipate failures, schedule interventions during low-impact windows, and prove ROI with hard numbers.


Why predictive maintenance for conveyor systems belongs on this year’s roadmap

Conveyors and sorters concentrate risk: when a few critical zones go down, the entire building feels it. Traditional preventive maintenance (PM) helps, but fixed intervals don’t reflect how your equipment is actually used. Some components are over-maintained; others fail early between cycles. Predictive maintenance (PdM) addresses the variability by combining condition data, event histories, and usage context to forecast failure probability and trigger the right action at the right time.

Operational benefits you can bank on:

  • Higher availability: Identify bearing wear, belt tracking drift, and motor overloads before they trip.
  • Lower maintenance spend: Replace parts at end-of-life, not by calendar.
  • Shorter MTTR: When a failure does occur, root cause is faster with richer history.
  • Safer recoveries: Early warnings reduce “fire-fighting” in hazardous locations.
  • Better planning: Align labor, spares, and production schedules with predicted needs.

The conveyor failure modes that lend themselves to prediction

Not every issue demands sensors, but many high-impact modes leave signatures you can catch early:

  • Rolling element bearings: Rising overall vibration, increasing high-frequency acceleration, temperature creep, and spectral features at BPFO/BPFI/FTF/BSF (outer/inner race, cage, ball spin).
  • Gearboxes & reducers: Mesh frequency sidebands, oil temperature, debris on magnetic plugs.
  • Belts & rollers: Tracking drift (edge temperatures), splice fatigue (acoustic anomalies), increasing slip (VFD torque uptick without corresponding speed).
  • MDR (motor-driven rollers): Current spikes, stall counts, thermal throttling, increased start attempts per accumulated carton.
  • Idlers & pulleys: Elevated trending temperature, squeal signatures, increasing drag torque.
  • Photo-eyes & sensors: Stuck-on/off patterns, rising debounce counts, abnormal block duration distributions.
  • Print-and-apply systems: Label reprint loops, verify-fail rates, head temperature anomalies.
  • Sortation modules: Early/late hit growth, encoder jitter, divert actuator cycle-time drift.

The four-layer architecture for predictive maintenance that actually scales

  1. Sensing & data acquisition
    • Discretes from PLC/HMI: alarms, jam counters, E-stop activations, device states, VFD trips, MDR sleep/wake, encoder health, scan pass/reprint.
    • Condition sensors: accelerometers (vibration), RTDs/thermistors (temperature), current transformers (motor current), acoustic/ultrasonic mics (air leaks, splices), oil debris sensors (critical reducers).
    • Sampling strategy: high-rate (1–5 kHz) for short vibration bursts during start/steady runs; low-rate (1–60 s) for temperatures and counters. Use event-triggered snapshots to keep storage modest.
  2. Edge logic in the controls layer
    • Normalize tags and timestamps, compute simple features (RMS, kurtosis, crest factor, spectral peaks), and filter noise.
    • Gate alerts with permissives (e.g., only evaluate bearing features when the zone is in RUN and speed > threshold).
    • Push compact metrics to the historian; keep PLC scan cycles lean by batching writes.
  3. Historian + analytics
    • Store timeseries with context: area, zone, device_type, device_id, speed, load, ambient.
    • Run trend thresholds, anomaly detection, and survival models. Start with rules; add ML once you’re collecting clean history.
    • Compute Remaining Useful Life (RUL) estimates for high-value components.
  4. Action orchestration
    • Tie alerts to work orders with severity, proposed action, parts, estimated duration, and latest safe windows.
    • Expose “what, where, when” on HMI and a browser dashboard.
    • Close the loop by capturing action taken and outcome for model feedback.

Data you already have (use it before buying more sensors)

Many conveyor facilities sit on a goldmine of PdM signal locked inside the PLC and VFDs:

  • Motor current & torque: Detects emerging mechanical drag and misalignment.
  • Start/stop counts & run hours: Aging proxies that improve interval targeting.
  • VFD fault codes: Overcurrent, overtemp, under-voltage—each maps to mechanical or electrical precursors.
  • Encoder status & missed pulses: Early warning for divert timing drift.
  • Jam density by hour/location: Shows where friction or tracking worsens under load.
  • MDR retries & sleep/wake cycles: Identify under-lubricated rollers or mis-zoned accumulation.

Combine these with simple temperatures (stick-on sensors at suspect bearings) and you can launch a credible PdM program in weeks, not months.


A step-by-step implementation plan

Step 1: Baseline your line

  • Map every critical asset: bearings, reducers, motors, MDR banks, sorters, print/apply, scanners.
  • Pull three months of alarm and downtime history. Build a Pareto of top failure modes and affected zones.
  • Record normal ranges: motor current at typical speeds, VFD drive temperatures, jam counts per 1,000 cartons.

Deliverable: A prioritized risk register with the 10 components most worth instrumenting first.

Step 2: Define your starter metrics

Pick 8–12 metrics with clear thresholds:

  • Bearing RMS acceleration, bearing temperature delta over ambient, gearbox oil temp, VFD torque %, encoder jitter % of window, MDR stall count/shift, label reprint ratio, photo-eye bounce rate.
  • Set alert levels: Information (watch), Action Soon (schedule on next window), Action Now (controlled stop).

Deliverable: Metric dictionary with units, sampling, and alert criteria.

Step 3: Instrument and integrate

  • Add stick-on temperature sensors to critical bearings; deploy a handful of triax accelerometers on the worst offenders.
  • Wire sensors to IO or an edge gateway; publish metrics to your historian with area/zone/device keys.
  • Update PLC/HMI to show condition status per device and a line-level “health score.”

Deliverable: Live dashboards in the maintenance shop and supervisor area.

Step 4: Pilot and tune on one merge/divert cell

  • Run for 4–6 weeks across real SKU mixes and temperatures.
  • Validate that “Action Soon” alerts lead to observable degradation or post-maintenance improvements.
  • Adjust thresholds to limit nuisance noise and missed detections.

Deliverable: Before/after analysis with MTTR, avoidable downtime, and maintenance labor hours.

Step 5: Scale by playbook

  • Clone the working configuration across similar zones, with local threshold adjustments.
  • Add one new metric per quarter (e.g., acoustic for splices) instead of sprawling all at once.
  • Formalize change control: versioned thresholds, alert texts, and escalation paths.

Deliverable: A documented, supportable PdM standard your team can own.


Choosing sensors that match conveyor realities

  • Vibration (accelerometers): Best for bearings/reducers. Mount on solid, grease-free surfaces near load paths; align axes consistently. Consider magnetic bases only for testing—hard-mount for production.
  • Temperature (RTD/thermistor): Cheap and powerful for trend detection. Careful with radiant heat near drives and ovens; use deltas to ambient.
  • Current transformers: Non-intrusive; great for MDR banks and motor drag detection.
  • Acoustic/ultrasonic: Useful for splice issues, air leaks, and some bearing faults behind guards.
  • Oil debris sensors: High value for expensive reducers with long lead times.

Aim for few, well-placed sensors tied to obvious actions rather than sensor sprawl that overwhelms your team.


Analytics that move the needle (without boiling the ocean)

Start with rules and trends; keep math explainable to technicians.

  • Trend + rate-of-change: Temperature exceeding baseline by +10 °C and rising >2 °C/hr under steady load.
  • Threshold + context: VFD torque > 85% for > 10 s while speed constant ±2%.
  • Composite health score: Weighted blend of normalized metrics (0–100) per device and per zone.
  • Survival models (next step): Once you have a year of data, fit Weibull curves to time-to-failure with covariates like load, starts/hour, ambient temp.

Rule of thumb: If a rule can’t be explained on a whiteboard to a new hire in five minutes, it will not survive turnover.


How predictive maintenance changes day-to-day work

  • Maintenance planners shift from saturated weekly PMs to targeted interventions on flagged devices.
  • Technicians use the HMI to see device condition and step-by-step tasks with safety notes.
  • Operations leads get early visibility of risk and can reslot labor or adjust release rates.
  • Buyers stock the right spares, not a mountain of “just in case” parts.

The cultural shift: less heroics, more routines. The floor feels calmer because surprises decline.


Safety remains the gatekeeper

Predictive maintenance reduces emergency work in hazardous spots, but safety interlocks still rule. Any action triggered by PdM must honor:

  • LOTO procedures before entering guarded areas.
  • E-stop and permissive logic—controls must verify safe states before enabling jogs and tests.
  • HMI guidance that spells out PPE, pinch points, and restart sequences.

Proving ROI with hard numbers

Tie improvements to metrics the CFO and GM care about:

  • Availability (A): Uptime increase vs. baseline (e.g., 98.3% → 99.2%).
  • Performance (P): Fewer rate dips near merges/diverts; stable hourly throughput.
  • Quality (Q): Reduced mis-sorts and label reprints tied to mechanical stability.
  • MTTR/MTBF: Shorter repair times and longer intervals between incidents on the same asset type.
  • Maintenance cost per carton: Parts + labor normalized by volume.
  • Energy per carton: Lower torque and fewer jams reduce kWh/carton.

A conservative target after a focused, 90-day pilot: 20–40% reduction in avoidable downtime on the instrumented cell and a 10–15% cut in maintenance labor spent on that cell—numbers that compound when scaled.


Common pitfalls and how to avoid them

  • Alert noise: Too many “yellow alerts” train people to ignore the system. Start narrow, escalate slowly.
  • Unlabeled data: Without device IDs and context (speed/load), analysis collapses. Standardize tags first.
  • Skipping the pilot: Rolling out everywhere before tuning will drown teams. Pilot, then scale.
  • No closed loop: If alerts don’t create work orders with outcomes, models won’t improve.
  • Sensor sprawl: More is not better. Instrument the 10 assets that cause 80% of pain.

Example playbook: a merge-divert cell

Baseline: Repeated late hits on Lane 3; occasional belt wander and high jam density in the hour after lunch.
Instrumentation: VFD torque % on upstream motor, encoder jitter %, bearing temp on two idlers, acoustic mic above splice area.
Rules:

  • Torque > 85% for >10 s at steady speed → inspect drag sources.
  • Encoder jitter > 2% of window for 5 min → check tension and alignment.
  • Bearing temp Δ > +12 °C sustained → lube or swap.
  • Acoustic spikes above baseline during steady packout → inspect splice.
    Outcome after 6 weeks: 38% reduction in jams, zero late hits for 21 consecutive days, 12% less energy in the cell, two planned bearing swaps during low-impact windows.

Integration with your existing PLC/HMI

  • HMI additions: “Condition” column next to state (RUN/STARVED/BLOCKED/FAULT) with green/amber/red status and recommended action.
  • Alarm philosophy: Each PdM alert must include cause, consequence, and action. Link to SOPs and LOTO steps.
  • Historian writes: Batch commits every 5–10 s to protect scan cycles.
  • Security: Role-based access for threshold edits; audit changes.

Building the team and cadence

  • RACI: Operations owns outcomes; Maintenance owns actions; Controls owns data plumbing; IT secures storage and access.
  • Weekly PdM stand-up: 20 minutes to review top risks, scheduled actions, and after-action notes.
  • Quarterly calibration: Add or retire metrics, update thresholds, and refresh training for new hires.

External resource for deeper reading

For a vendor-neutral introduction to condition-based and predictive strategies (with practical maintenance checklists and ROI framing), see the U.S. Department of Energy’s guide:
Operations & Maintenance Best Practices Guide


How Lafayette Engineering implements predictive maintenance for conveyor systems

  • Controls-first instrumentation: We expose high-value signals already in your PLC/VFDs and add targeted sensors only where they improve decisions.
  • Operator-centered HMI: ISA-101-aligned screens put condition and action side by side, cutting MTTR.
  • De-risked rollout: One representative cell first, micro-windows for installs, tested rollback images.
  • Data with context: Every metric lands in your historian with area/zone/device IDs and operating state, enabling reliable trend analysis and RCA.
  • Measurable results: We baseline, pilot, and report deltas in availability, jam density, and energy per carton so the business case is transparent.

Warehouse Execution System: A Practical Warehouse Execution System Guide for Conveyor-Driven Fulfillment

pallet management

Warehouse execution system is the keyword because a warehouse execution system (WES) is the orchestration layer that synchronizes labor, conveyors, sorters, AMRs, printers, and host messages in real time so your fulfillment operation runs predictably at peak. A strong WES strategy helps Lafayette Engineering clients translate business rules into safe, repeatable motion—without ripping and replacing working assets.


What a warehouse execution system actually does

At its core, a WES is the conductor for the busy “orchestra” on your floor: it sequences work releases, balances queues, prevents starvation/blocking at merges, and adjusts flow when reality changes (jam at a divert, printer offline, staff shift change). In technology terms, WES sits between your host (ERP/WMS) and your control layer (PLC/HMI/WCS) and coordinates the physical flow of products from induct to ship across people and machines. Authoritative definitions consistently position WES as the real-time layer bridging WMS planning and WCS device control, especially in automation-heavy facilities. Wikipedia+2autostoresystem.com+2

WES vs. WMS vs. WCS (in one minute)

  • WMS plans inventory and orders, manages locations, and allocates work (what should happen).
  • WES sequences and paces work in real time, deciding which tasks should flow next to maintain stability (when and in what order it should happen).
  • WCS drives devices like conveyors, sorters, and AS/RS at the millisecond level (how motion actually happens).

Industry primers clarify that these roles overlap in practice, but WES emerged specifically to fill the gap between high-level plans (WMS) and low-level machine control (WCS) as distribution grew more automated. MHI Blog+1


Why WES matters more in conveyor-heavy operations

Conveyor/sorter environments magnify small timing problems. A mis-sequenced release upstream can starve a divert or create blocking at a merge; a late label reprint can ripple into missed carrier cutoffs. A WES helps by:

  1. Smoothing flow. It meters releases so downstream lanes stay “just full enough,” maintaining rate without chaos.
  2. Responding to reality. When a jam fires, it pauses and re-routes work, notifies HMI users, and automatically restarts when safe.
  3. Unifying islands. AMRs, put walls, print-and-apply, weigh/dim/scan, and conveyors stop acting like separate worlds.
  4. Making data actionable. It exposes queues, rates, mis-sorts, and jam density so operators focus on the few things that move the needle.

Where WES fits in the ISA-95 stack (and why that’s helpful)

ISA-95 (IEC 62264) is the standard language for how enterprise systems connect to operations. It separates business planning (Level 4) from manufacturing/operations (Level 3) and controls (Levels 2/1). WES typically spans the Level-3 orchestration space, drawing signals from Level-2 controls and sharing status with Level-4 planning. Thinking in ISA-95 terms helps you assign clean responsibilities and interfaces so projects avoid “responsibility fog.” reference.opcfoundation.org+3isa.org+3Siemens Digital Industries Software+3


Ten high-impact WES capabilities for a conveyor DC

  1. Wave-less order release with dynamic throttling
    Instead of fixed waves, the WES continually releases work based on live capacity at merges/diverts, keeping rates flat through shift changes and micro-stoppages. Wikipedia
  2. Merge and divert protection
    The WES monitors queue lengths and divert hit windows; it slows upstream induction to prevent chronic blocking and raises alarms before rates collapse.
  3. Exception loops and automatic retries
    Unreadable labels or overweight cartons route to QA spurs; once corrected, items re-join flow with proper priority to hit carrier cutoff.
  4. Role-aware UIs and guided recovery
    Operators see simple “what to do next” prompts; technicians get device-level states, photo-eye health, and interlocks on HMI screens aligned to ISA-101 principles. (LEI’s controls/HMI approach pairs clean alarms with actionable steps.)
  5. Carton and tote genealogy
    The system tracks each unit’s history—induct time, weight/scan results, lane assignment, retries—so support teams can diagnose issues fast.
  6. Carrier/service-level awareness
    Work is sequenced to hit service windows, not just to drain a backlog. During spikes, the WES biases flow for time-sensitive orders.
  7. AMR/robot orchestration
    If your packout relies on AMRs feeding induction or put walls, WES coordinates run assignments so those cells never starve.
  8. Print-and-apply resilience
    The WES validates prints, triggers reprints on failure, and manages short-term recycling to keep lanes moving.
  9. Energy-aware pacing
    With MDR conveyors and VFDs, the WES can use idle/sleep policies during lulls to reduce kWh/carton—without hurting throughput.
  10. Analytics for continuous improvement
    Standard dashboards: rate by hour/zone, mis-sorts, recycle ratio, jam density, MTTR/MTBF, and “repeat offender” device ranks.

Three ways to adopt WES (with pros and cons)

1) Add WES to an existing WMS + WCS stack

You keep your WMS for inventory and your controls/WCS for devices, and add a WES to orchestrate execution.

  • Pros: Minimal disruption to master data; fastest way to gain real-time pacing; good for conveyor retrofits.
  • Cons: Requires robust interfaces; overlapping features must be rationalized.
  • Best when: You’re automation-heavy and already hitting WMS/WCS limits on flow stability.

2) Enable WES-like features inside your modern WMS

Some WMS platforms now offer “WES modules.”

  • Pros: Fewer vendors and integrations; a single data model.
  • Cons: May be less granular in device-level control; risk of vendor lock-in.
  • Best when: You’ve standardized on a single platform and the vendor’s WES depth matches your automation profile.

3) Build a lightweight WES layer with your integrator

You keep the WMS as is, expand WCS capabilities, and add a small orchestration service that sequences releases and manages exceptions.

  • Pros: Laser-focused on your flow; cost-effective; tight alignment with your conveyors/HMI.
  • Cons: Requires a disciplined product mindset to avoid “custom tool sprawl.”
  • Best when: Your constraints are specific (e.g., two merges and one sorter) and you value speed and control.

Industry literature shows all three patterns in the wild; the right choice depends on automation density, IT appetite, and timeline. MHI Blog+1


A conveyor-focused WES architecture blueprint

  • Integration bus: Clear, versioned messages between WMS↔WES (order lines, priorities) and WES↔controls (start/stop, line states, alarms).
  • Orchestration engine: Rules for release pacing, carrier priority, exception handling, and “never starve/never block” merges.
  • Device abstraction: A standard way to talk to PLCs/HMIs regardless of conveyor brand; normalize states like RUN, STARVED, BLOCKED, FAULT.
  • User experience: HMI aligned to ISA-101 with alarm philosophy (cause, consequence, action), plus browser dashboards for leads and supervisors.
  • Historian/time-series DB: Append-only logs for alarms, queues, rates, and mis-sorts to support RCA and CI.
  • Security & networks: Segmented OT network, least-privilege roles, MFA for remote access, routine backups, and change control.

Mapping these roles to ISA-95 clarifies who owns what: WMS owns inventory truth (Level 4), WES owns execution sequencing (Level 3), controls/HMI own the physics (Levels 1–2). isa.org+1


How to decide you’re ready for WES

Answer “yes” to most of these, and you’ll likely see outsized ROI:

  • You rely on conveyors/sorters and see blocking or starvation around merges/diverts during peaks.
  • You frequently miss carrier cutoffs despite “enough capacity on paper.”
  • You see repeatable patterns in jam density and label reprint loops that human triage can’t keep up with.
  • Your WMS waves are either too big (downstream chaos) or too small (too much manual babysitting).
  • Leads spend more time reacting than proactively pacing the floor.

Implementation roadmap (with zero-surprise cutovers)

  1. Discovery & baselining
    • Time-stamp queue lengths at merges and divert windows for a week.
    • Measure scan-to-divert latency and reprint rates.
    • Identify top 10 jam locations by hour and SKU class.
  2. Design & emulation
    • Define message schemas and pacing rules; emulate with recorded host traffic.
    • Draft HMI/Dashboard views; embed SOP links and alarm actions.
    • Align ISA-95 responsibilities with stakeholders so no one owns a “ghost” interface. isa.org
  3. Pilot on a representative flow
    • Choose a lane with real complexity (not the easiest).
    • Track before/after: rate stability, jam MTTR, mis-sorts, recycle ratio.
  4. Stage rollout
    • Weekend micro-windows per zone; keep a tested rollback image.
    • Daily KPI huddles for two weeks; tune thresholds and priorities.
  5. Stabilize & standardize
    • Freeze function blocks and message contracts; document alarm philosophy.
    • Train operators and technicians with role-based checklists.

Safety and compliance are built in, not bolted on

Conveyors include moving parts and nip points. Whether WES decisions start/stop or re-route units, the physical system must never enable unsafe motion. That means controls interlocks (E-stops, guards, safety relays) remain authoritative—and HMI must clearly display permissives so recovery follows lockout/tagout and SOPs. OSHA’s general machine-guarding standard (29 CFR 1910.212) is the baseline reference you should map into HMI prompts and commissioning checklists; many conveyor guidance documents point to the same requirement: guard all exposed moving parts presenting hazards. OSHA+2OSHA+2


KPIs your WES should publish on day one

  • Throughput (ctns/hr) by zone and hour with targets
  • Divert accuracy and late/early hit counts
  • Scan pass rate, label reprints, and recycle ratio
  • Jam rate and MTTR at the top 10 jam locations
  • Queue health at merges (min/avg/max) to prove “never starve/never block”
  • Energy per carton where VFD/MDR sleep is used
  • Safety metrics: interlock defeats, E-stop activations (context only)

Build vs. buy: questions to keep your options open

  • Scope fit: Does the WES handle your exact exception types (e.g., overweight, unreadable, duplicate) without scripting gymnastics?
  • Device abstraction: Can it normalize different conveyor vendors and PLCs without brittle adapters?
  • Analytics depth: Are you getting simple counters or enough context for RCA (zone, device, code, duration, product)?
  • UX maturity: Are HMI and dashboards aligned to ISA-101 so training is quick and alarm noise is limited?
  • Security & governance: Roles, audit trails, backups, and clean OT/IT separation are non-negotiable.
  • Standards alignment: Are interfaces documented in ISA-95 terms so future changes don’t shatter brittle integrations? The ANSI Blog

Example day-in-the-life scenarios WES should solve

  1. Printer outage at mid-shift
    WES detects label verify failures, triggers reprints to a healthy head, and pushes unreadables to a recycle spur—then automatically drains the loop when the head returns.
  2. Divert lane trending late hits
    Live analytics show a drift in hit windows; WES slows upstream release, flags a tech via HMI, and suggests a check on encoder counts or PE alignment.
  3. Carrier cutoff crunch
    With 40 minutes left, WES re-prioritizes orders for two service levels, pushes non-criticals to a buffer, and keeps merges balanced to avoid a rate dip.
  4. Jam at merge #2
    WES holds upstream queues, pauses non-critical releases, displays a step-by-step clearance SOP on HMI, and re-starts zones in safe order—no big bang, no spring-loaded chaos.
  5. Unexpected SKU mix shift
    Bulkier cartons appear; WES increases spacing, retimes a divert, and alerts the lead that rate will be 7% lower until the mix normalizes—avoiding “mystery slowdowns.”

Common project pitfalls (and how to avoid them)

  • Overlapping responsibilities. If both WMS and WES think they own wave release, the floor pays the price. Lock responsibilities using ISA-95 language. isa.org
  • Underspecified exceptions. Define how unreadables, over-weights, shorts, and duplicates behave—including priorities after fix.
  • HMI clutter. Align to ISA-101: restrained color, consistent navigation, and alarms with cause–consequence–action.
  • Thin data. Count more than “good vs. bad.” Capture context to power meaningful RCA and continuous improvement.
  • Security blind spots. No shared logins, no flat networks, and no untracked remote connections.

Frequently asked questions

Is WES only for highly automated sites?
No. WES delivers value anywhere work release and exception handling affect rate stability. The more conveyors/sorters you have, the bigger the gains—but even moderate automation benefits from smarter pacing. Wikipedia

Will WES replace our WMS?
Unlikely. WES complements WMS by translating plans into real-time motion and by absorbing shocks (device faults, staffing changes) that plans don’t see. Some platforms blend roles; clarity matters more than labels. MHI Blog

Can we phase in WES without disrupting peak?
Yes. Pilot a representative lane, use weekend micro-windows, keep a tested rollback image, and expand zone by zone.

How does WES impact safety?
WES improves human factors by guiding recovery and reducing scramble, but mechanical safety remains the controls layer’s domain. All guarding and interlocks must be validated per OSHA machine-guarding requirements. OSHA


External resource (for readers who want a neutral overview)


How Lafayette Engineering can help

Lafayette Engineering is a controls-first integrator. That shows up in three ways when we implement a warehouse execution system strategy:

  1. Data-driven discovery. We instrument merges and diverts, baseline jam density and scan-to-divert latency, and identify the smallest WES scope that unlocks the largest throughput stability.
  2. Operator-centered HMI. ISA-101-aligned screens surface the right context at the right time, cutting MTTR and training time.
  3. Phased deployments. We de-risk with emulation, micro-windows, and rollback images so your first day of peak feels like week 10—not a science experiment.

PLC Migration: A Comprehensive, No-Downtime Roadmap for Aging Conveyor Systems

Conveyor Control

PLC migration is the most reliable way to extend the life of your conveyor systems, unlock advanced diagnostics, and reduce unplanned downtime—without ripping out good steel or disrupting operations during peak.

Executive overview

Modern fulfillment demands faster rates, better accuracy, and real-time visibility. Legacy PLCs (e.g., SLC-500, PLC-5, Siemens S7-300, GE 90-30) still run many facilities, but parts scarcity, limited memory, and dated communication buses turn every fault into a fire drill. A well-planned PLC migration replaces or stages out obsolete controllers, field I/O, and operator interfaces while preserving mechanical assets. The outcome is a safer, more supportable line with standardized function blocks, role-based HMI, and data hooks for WES/WMS analytics.

This guide details the why, what, and how—down to field cutovers, validation checklists, testing strategies, and KPIs. It also compares three migration methods with pros/cons so you can match approach to risk tolerance and budget.


Why migrate now

  1. Parts availability: OEM refurb channels are thin and costly; lead times for legacy cards can be months.
  2. Diagnostics: Older systems lack structured alarms, per-zone counters, and historian support. Root cause analysis suffers.
  3. Cybersecurity: Unsupported firmware and flat networks expand attack surfaces.
  4. Talent pipeline: Fewer technicians are fluent in legacy instruction sets; standardized IEC 61131-3 languages broaden supportability.
  5. Business agility: E-commerce volatility requires flexible logic, modular zones, and data for continuous improvement.

Strategic objectives to set before you start

  1. Throughput & accuracy targets: e.g., 15% rate increase, 30% mis-sort reduction.
  2. Uptime & MTTR: achieve ≥ 99.5% line availability; cut mean time to clear top 10 alarms by 40%.
  3. Safety: re-validate guarding, interlocks, and E-stops; align HMI alarm instructions with LOTO/SOPs.
  4. Supportability: one library of reusable function blocks, uniform tag naming, version control, and tested rollback plans.
  5. Data & integration: expose counters, queue lengths, scan pass rates, and divert windows to your WES/WMS/BI stack.

Three PLC migration methods (with pros and cons)

Method A: “Like-for-Like” swap with conversion tools

You replace legacy CPUs with modern controllers and convert logic using vendor utilities or structured mapping.

  • Pros
    • Fastest schedule when I/O and field wiring remain.
    • Lower cost than full re-architecture.
    • Limits change management for operators and maintenance.
  • Cons
    • You inherit some old logic assumptions.
    • Limited chance to re-standardize naming and alarm philosophy.
    • May not exploit new controller features fully.
  • Best for
    • Facilities needing immediate risk reduction with tight outage windows.

Method B: Staged migration by zone (“brownfield refactor”)

You carve the conveyor into logical islands (induct, accumulation, merges, sortation) and modernize one island at a time.

  • Pros
    • Minimal downtime; can perform weekend cutovers.
    • Enables standard libraries and HMI redesign per zone.
    • Easier rollback per stage.
  • Cons
    • Requires temporary bridges between old and new networks.
    • Longer calendar duration; more coordination.
  • Best for
    • Active distribution centers with no full-day outage availability.

Method C: Parallel rack & shadow run (emulation + hard cut)

You build a new controller rack and I/O in parallel, emulate with live host messages, and execute a single “swing-over.”

  • Pros
    • Clean slate for tags, function blocks, and alarm philosophy.
    • Full FAT/SAT before production traffic.
  • Cons
    • Highest upfront cost and engineering effort.
    • Requires physical space and careful cable management.
  • Best for
    • High-speed sortation where any live refactor risk is unacceptable.

Architecture blueprint for a modernized conveyor controls layer

  1. Controller platform
    • IEC 61131-3 support (Ladder, FBD, ST) for portability and maintainability.
    • Firmware standardization across sites; locked bill of materials.
  2. I/O strategy
    • Distributed I/O over a deterministic industrial network (e.g., EtherNet/IP, PROFINET).
    • Segregate safety I/O; use safety relays or TÜV-certified safety PLCs where appropriate.
    • Provide extra spare channels for growth and faster field swaps.
  3. Networks
    • Layer-3 segmentation: cell/area zones per ISA/IEC 62443; VLANs for controls vs. business traffic.
    • Managed switches with IGMP snooping, QoS, and ring redundancy.
    • Firewall rulesets between OT and IT; DMZ for historians and WES/WMS brokers.
  4. HMI & alarm philosophy
    • ISA-101 style: restrained color, consistent navigation, alarm states with cause-consequence-action.
    • Role-based screens (operator, technician, supervisor).
    • Embedded SOPs and guided fault clearance.
  5. Data layer
    • Historian or time-series DB for alarms and KPIs.
    • Contextual tags: zone_id, device_type, fault_code, duration, product_id (if available).
    • Standard payloads to WES/WMS (scan pass, divert confirm, reprint, recycle).

Function block standards that pay dividends

  • Start/Stop/Estop/Permissives: interlocks, safe torque off, heartbeat checks.
  • Photo-eye health: debouncing, stuck-on/off detection, and maintenance prompts.
  • MDR zones: accumulation logic with sleep/wake and jam detection.
  • Divert timing: encoder-based windows, early/late detection, automatic retry logic.
  • Labeling/Print-and-Apply: verify-then-release with reprint triggers.
  • KPI counters: throughput per zone, mis-sorts, recycle ratio, MTBF/MTTR.
  • Energy mode: graduated VFD ramp-up and idle schemes to cut demand peaks.

Detailed migration playbook

Phase 1 — Discovery and risk register

  • Inventory controllers, racks, cards, firmware, spare counts, and wiring topologies.
  • Map alarms and nuisance faults; collect at least two weeks of baseline data.
  • Identify single points of failure (SPoF) and safety circuits needing redesign.
  • Produce a risk register with mitigations and a RACI chart for cutovers.

Phase 2 — Controls design & emulation

  • Normalize tag naming: AREA_ZONE_DEVICE_SIGNAL.
  • Build function block library and document interfaces.
  • Create a digital twin/emulation to run host messages (scan, route, confirm).
  • Draft HMI navigation, alarm pages, and SOP linkouts; perform stakeholder review.

Phase 3 — Panel/rack build & FAT

  • Wire new racks with terminal blocks labeled by zone and device.
  • Bench-test I/O cards; simulate field inputs with toggles or simulators.
  • Validate alarm severity, text, and actions; verify historian writes and time sync.
  • Pre-stage network configs, switch rules, and controller firmware.

Phase 4 — Field install & SAT (staged or parallel)

  • Isolate one zone; land I/O tails on new terminals with documented loop checks.
  • Perform dry runs: start/stop, jog with interlocks, E-stop propagation.
  • Conduct live tests with cartons: measure scan-to-divert latency across rates.
  • Capture punch list; remediate before proceeding to the next zone.

Phase 5 — Ramp, training, and stabilization

  • Daily KPI huddles for the first two weeks; compare against baseline.
  • Retrain operators on HMI, alarm priorities, and guided recoveries.
  • Tune thresholds (e.g., jam timers, queue caps, MDR wake rules) from real data.
  • Final handover: backups, version control, and a rollback worksheet.

Validation & safety checklists (abbreviated)

Electrical & I/O

  • Correct card types/firmware; all channels mapped; spare capacity logged.
  • All field devices landed; polarity and shielding verified; noise mitigation in place.

Safety

  • Emergency stops tested for full de-energization; safe states confirmed.
  • Guard switches and light curtains verified; bypasses locked out.
  • LOTO instructions match the updated architecture; HMI reflects permissive states.

HMI & alarms

  • Alarm text: cause, consequence, corrective action; no duplicates or “alarm storms.”
  • Navigation depth ≤ two taps from line overview to device detail.
  • SOPs and one-point lessons embedded.

Networks

  • Redundancy validated; link loss/failover within targets.
  • Firewall rules documented; no direct business-to-PLC routes.
  • Time sync (NTP/PTP) consistent across PLC/HMI/historian.

Testing the right things (beyond “it runs”)

  • Scan pass vs. divert window across min/typ/max carton lengths.
  • Label retry edge cases: unreadable, duplicate, reprint behavior.
  • Jam density & clearance: top 10 jam locations, MTTR before/after.
  • Queue stability: never starve/never block logic at merges.
  • Energy profile: kWh/carton and demand peaks with new MDR sleep policies.
  • Human factors: time-to-first-meaningful-signal on HMI during an alarm.

Cutover scheduling patterns that work

  • Micro-windows: 4–6 hour Saturday blocks per zone with a hard rollback plan.
  • Pilot-then-scale: choose the most representative zone first (not the easiest).
  • Parallel QA spur: test advanced logic on a non-critical lane before mainline.
  • Shadow ops: emulate host traffic during live shifts to expose timing gaps early.

Cybersecurity considerations

  • Unique credentials and role-based access; audit trails on setpoint changes.
  • Network segmentation and read-only data diodes for enterprise analytics.
  • Patch/firmware cadence and backup discipline; secure remote access via VPN with MFA.
  • Vendor laptops and removable media policies; incident response runbook tied to OT realities.

KPI framework to prove ROI

  • Availability (A): scheduled time vs. downtime by category.
  • Performance (P): actual rate vs. theoretical rate per zone.
  • Quality (Q): mis-sorts, reprints, recycle loops.
  • MTTR/MTBF: alarm-level resolution times and device reliability.
  • Energy: kWh/carton and peak demand charges.
  • Safety: near misses, interlock defeats, E-stop activations.

Publish a “before/after” dashboard 30, 60, and 90 days post-migration, annotate changes, and lock in a quarterly continuous-improvement cadence.


Cost and timeline ranges (order-of-magnitude)

  • Like-for-Like (Method A): lowest cost; weeks from design to cutover; fastest inventory risk reduction.
  • Staged (Method B): moderate cost; 6–12 weeks calendar for a mid-size line; minimal disruption.
  • Parallel/Shadow (Method C): highest cost; 8–16 weeks; best for high-speed or highly regulated operations.

Budget sensitivity comes from I/O density, safety scope, panel space, and whether you add MDR islands or only modernize brains.


Frequently asked questions

Q1. Can we reuse our existing field wiring and sensors?
Often yes, especially with staged migrations. Validate device health and cabling; plan selective replacements for chronic offenders.

Q2. Will operators face a steep learning curve?
If HMI follows ISA-101, training is quick. Use consistent icons, zone maps, and guided recovery.

Q3. How do we avoid production risk?
Pilot one representative zone, keep a rollback image, and schedule micro-windows with clear success criteria.

Q4. What about our WES/WMS messages?
Define message schemas and timing early. Use emulation to stress-test scan-to-divert workflows before field installs.

Q5. Can we add analytics later?
Yes. If tags and historians are designed properly now, advanced analytics (rate prediction, jam propensity) are a bolt-on later.


External reference

For vendor-agnostic modernization context and practical checklists, see Rockwell Automation’s controller migration overview and modernization guidance:
Rockwell Automation — Modernization & Migration


How Lafayette Engineering executes PLC migration

  • Controls-first engineering with standard function blocks tailored to conveyor behavior.
  • Operator-centered HMI that reduces MTTR and surfaces the right context at the right time.
  • Staged implementation to maintain service levels, with emulation to de-risk host messaging.
  • Data-ready architecture that feeds WES/WMS and BI with clean, contextual signals.
  • Safety embedded in design and screens, not bolted on.

This Hidden Conveyor System Bottleneck Cost UPS $23 Million in Lost Productivity (The 5-Minute Diagnostic That Changes Everything)

Conveyor Systems

Every minute your conveyor system operates with bottlenecks and delays, you’re hemorrhaging money. Industry data reveals that the average distribution center loses $847,000 annually due to unidentified conveyor bottlenecks—yet 89% of facility managers have no systematic process to fix conveyor system bottlenecks and delays that are destroying their operational efficiency.

The shocking truth? Most companies invest millions in state-of-the-art conveyor equipment, only to watch it operate at 30-50% of rated capacity due to hidden bottlenecks that traditional engineering approaches can’t identify. Meanwhile, the top 1% of facilities that have mastered how to fix conveyor system bottlenecks and delays are processing 300% more volume using the same equipment their competitors struggle with.

At Lafayette Engineering, we’ve diagnosed and fixed conveyor system bottlenecks and delays for over 200 facilities across 35 years, unlocking over $380 million in previously wasted capacity. Today, we’re revealing the complete diagnostic and repair methodology that transforms bottleneck-plagued systems into high-performance operations.

The $23 Million Bottleneck Disaster That Nearly Destroyed a Logistics Giant

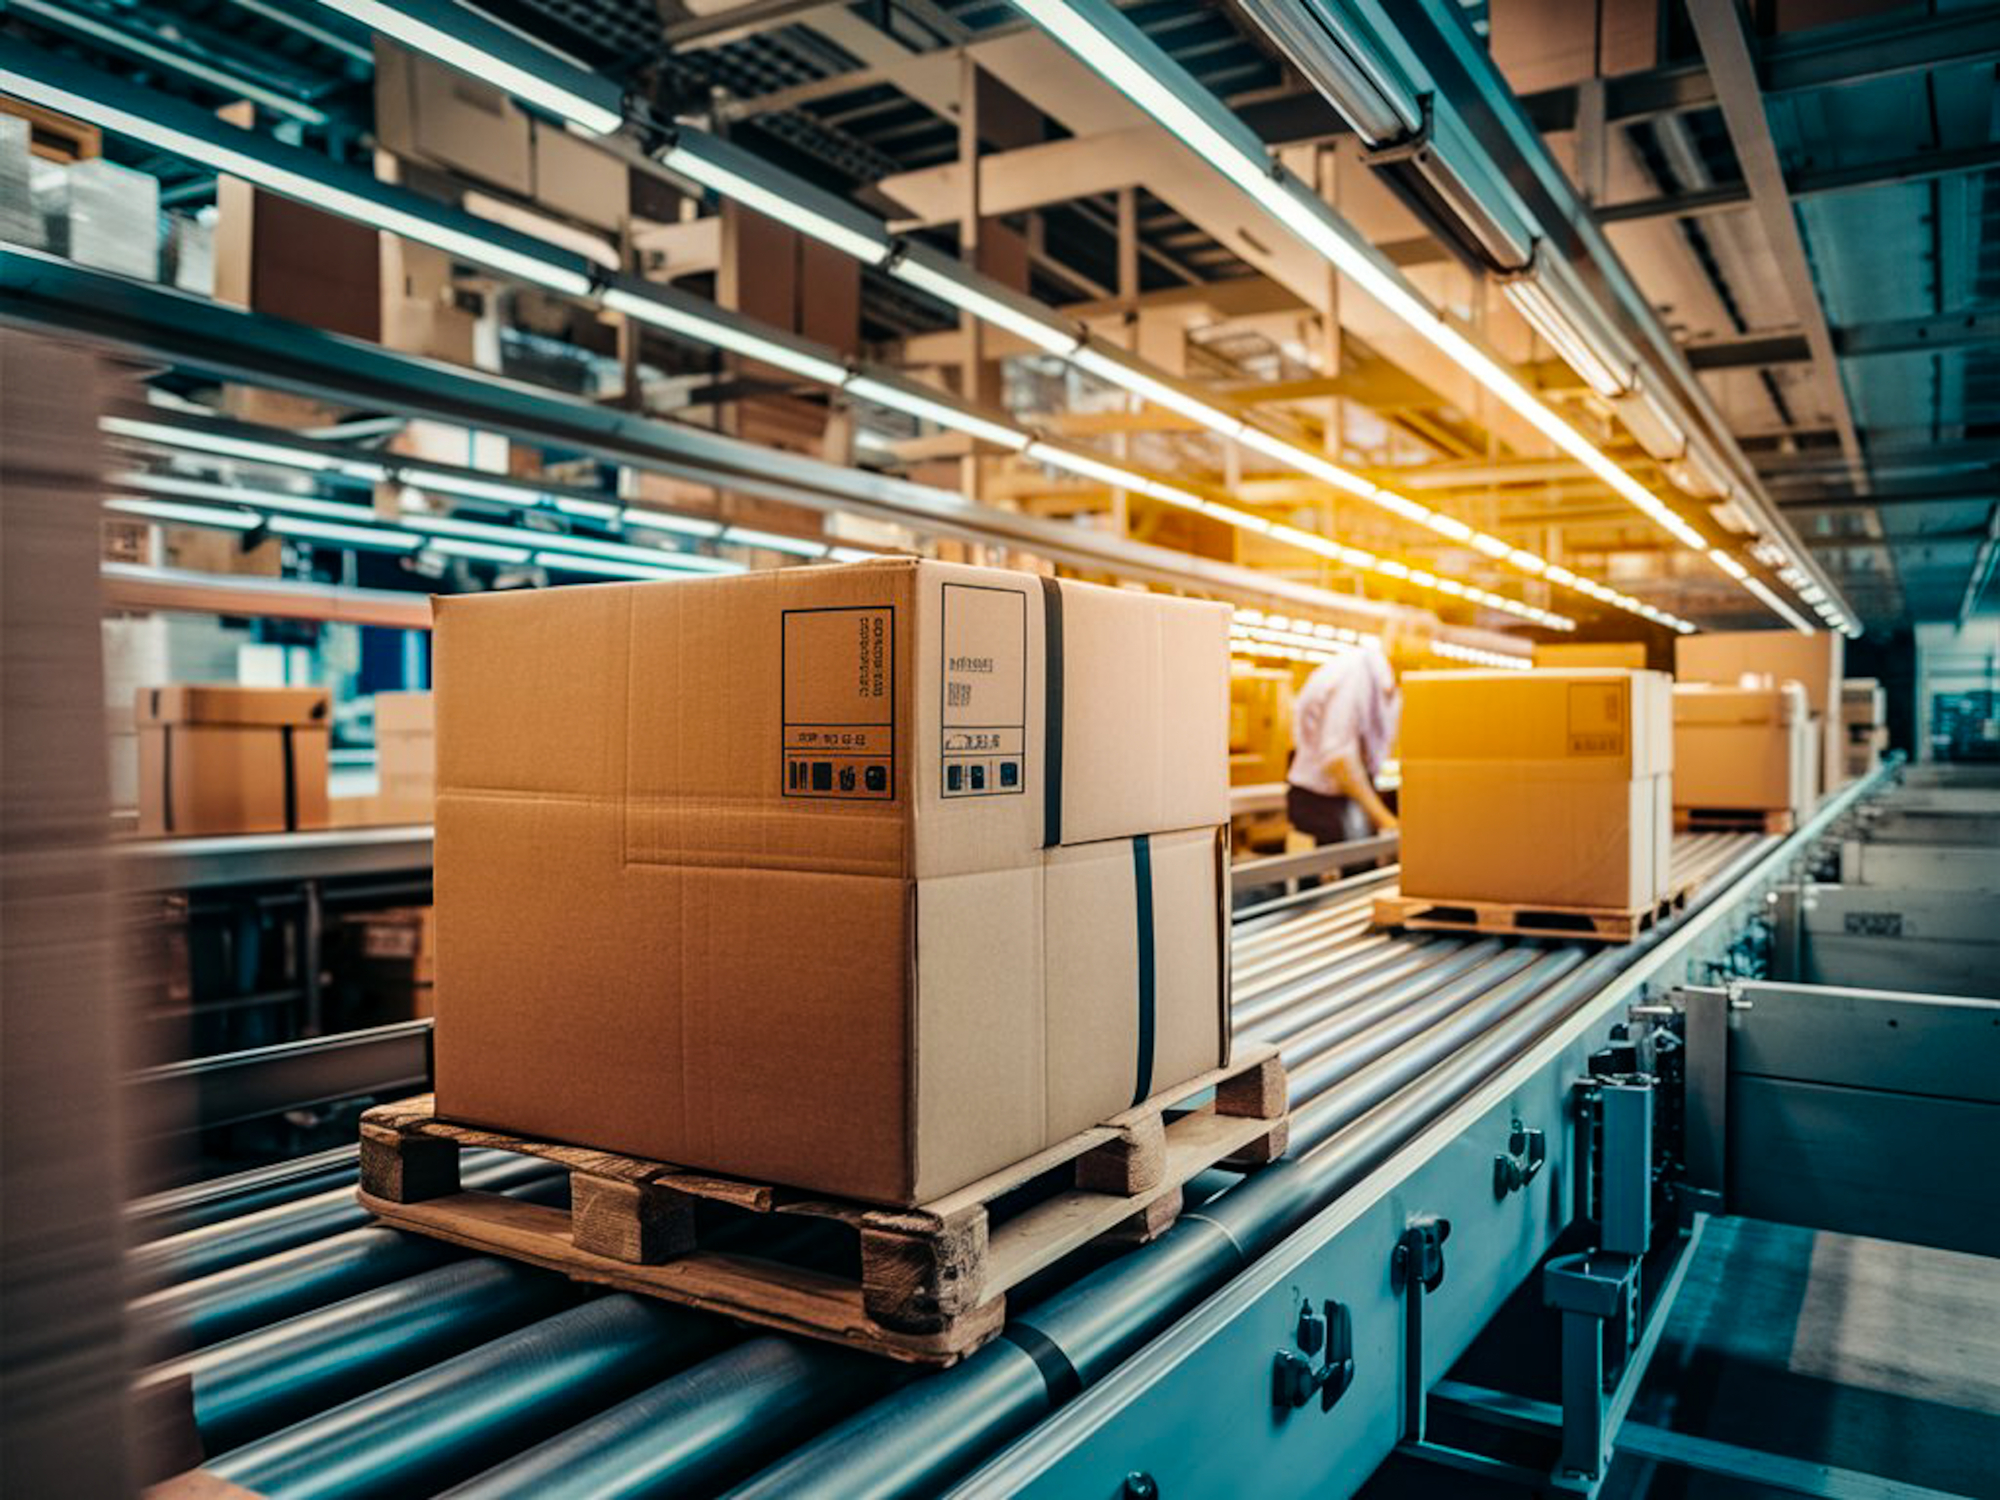
A major shipping company invested $12 million in a cutting-edge conveyor system designed to process 25,000 packages per hour. Engineering specifications were perfect. Equipment was top-tier. Installation was flawless. Yet six months after go-live, the system was processing only 8,700 packages per hour—just 35% of design capacity.

The Devastating Impact:

  • Lost processing capacity: 16,300 packages per hour
  • Additional labor costs to compensate: $4.8 million annually
  • Missed delivery commitments: $3.2 million in penalties
  • Emergency overtime and temporary workers: $2.1 million annually
  • Deferred growth opportunities: $8.4 million in lost revenue
  • Customer satisfaction decline: Immeasurable long-term damage
  • Total annual impact: $23.7 million in losses and opportunity costs

Multiple engineering teams from the equipment vendors analyzed the system. Consultants were brought in. Modifications were made. Nothing worked. The bottlenecks persisted, and no one could explain why a system that should work perfectly was failing so spectacularly.

The Lafayette Engineering Diagnostic Approach:

Our team deployed advanced diagnostic techniques specifically designed to fix conveyor system bottlenecks and delays that traditional analysis methods miss:

  1. Real-time flow analysis using high-speed cameras and sensors
  2. Comprehensive system modeling including all interdependencies
  3. Control logic audit examining PLC programming for artificial constraints
  4. Merge point analysis studying collision and gap dynamics
  5. Equipment synchronization review checking speed relationships

The Critical Discoveries:

Within 48 hours, our diagnostic process identified three critical bottlenecks that engineering teams had completely missed:

Bottleneck #1 – Merge Point Collision Avoidance: The PLC programming included overly conservative gap requirements at merge points, creating artificial capacity constraints that reduced throughput by 48%.

Bottleneck #2 – Speed Mismatch Cascade: A 12% speed differential between upstream and downstream zones created cumulative gaps in product flow, reducing effective capacity by 31%.

Bottleneck #3 – Sortation Logic Inefficiency: The sortation programming used sequential processing that created delays during high-volume periods, constraining capacity by 26%.

The Fix Conveyor System Bottlenecks Solution:

Lafayette Engineering implemented targeted solutions that required zero equipment changes:

  • Optimized merge point programming with intelligent gap management
  • Implemented dynamic speed synchronization across all zones
  • Deployed parallel processing sortation logic with predictive routing
  • Added real-time performance monitoring with automatic adjustment
  • Created comprehensive operator training on system optimization

The Spectacular Results:

  • System capacity increased from 8,700 to 27,200 packages per hour (313% increase)
  • Exceeded original design specification by 8.8%
  • Implementation cost: $180,000 (vs. $12 million original investment)
  • Annual savings: $18.6 million
  • ROI: 10,333% in first year
  • Payback period: 3.5 days

This case demonstrates why understanding how to fix conveyor system bottlenecks and delays is more valuable than the initial equipment investment itself.

The Hidden Science of Conveyor System Bottlenecks

Most facility managers and even experienced engineers don’t understand the complex dynamics that create conveyor system bottlenecks and delays. These aren’t simple mechanical problems—they’re systemic issues involving physics, control theory, and operational mathematics.

The Theory of Constraints in Conveyor Systems

Every conveyor system has one or more constraint points that limit overall system capacity. These bottlenecks determine maximum throughput regardless of how capable individual components are. Understanding this principle is essential to fix conveyor system bottlenecks and delays effectively.

Goldratt’s Constraint Theory Applied to Conveyors:

  1. Identify the constraint – Find the bottleneck limiting system capacity
  2. Exploit the constraint – Maximize throughput at the bottleneck point
  3. Subordinate everything else – Adjust all other operations to support the constraint
  4. Elevate the constraint – Increase capacity at the bottleneck point
  5. Repeat the process – Find the next constraint and continue optimization

Most facilities fail because they try to fix symptoms rather than identifying the true system constraint.

The Physics of Material Flow Dynamics

Conveyor system bottlenecks and delays occur due to fundamental physical principles that govern material flow:

Gap Dynamics: Products moving on conveyors must maintain minimum gaps for safe operation. When these gaps become too large, capacity decreases. When too small, collisions and jams occur. Optimal gap management is critical to fix conveyor system bottlenecks.

Accumulation Effects: Product accumulation at bottleneck points creates upstream congestion that propagates backward through the system, reducing overall capacity far beyond the bottleneck itself.

Flow Rate Variability: Inconsistent product introduction rates create waves of congestion and empty space that reduce effective system capacity by 30-60%.

Merge Point Mathematics: When multiple conveyor lines merge, the combined flow rate cannot exceed the downstream capacity. Poor merge control creates the most common bottleneck type.

Sortation Capacity Constraints: High-speed sortation requires precise timing. Inadequate sortation capacity creates upstream backup that limits entire system throughput.

Control System Limitations Creating Artificial Bottlenecks

Many conveyor system bottlenecks and delays are created by control system programming rather than physical equipment limitations. These artificial constraints are the easiest and most cost-effective to fix.

Common Control System Bottlenecks:

Conservative Safety Programming: Excessive safety margins in gap control and speed management reduce capacity without improving safety.

Sequential Processing Logic: Control programs that process one task at a time create artificial delays during high-volume periods.

Fixed Speed Operation: Systems running at constant speeds can’t optimize for varying product types and flow conditions.

Poor Exception Handling: Inadequate programming for handling errors causes entire system shutdowns rather than localized responses.

Limited Sensor Integration: Insufficient real-time data prevents dynamic optimization and bottleneck prevention.

The Complete Methodology to Fix Conveyor System Bottlenecks and Delays

Successfully fixing conveyor system bottlenecks requires a systematic diagnostic and optimization approach that addresses root causes rather than symptoms.

Phase 1: Comprehensive Bottleneck Diagnostic (Week 1-2)

Step 1: System Performance Baseline

Document current system performance across all operational scenarios:

  • Maximum sustained throughput rate (packages/cases per hour)
  • Peak throughput during optimal conditions
  • Average throughput across full shifts
  • Throughput variation by product type and mix
  • Downtime frequency and duration
  • Error rates and jam occurrences

Baseline Performance Analysis: Compare actual performance to design specifications. Gaps exceeding 20% indicate significant bottleneck issues requiring immediate attention to fix conveyor system bottlenecks and delays.

Step 2: Flow Observation and Mapping

Conduct detailed observation of product flow throughout the system:

  • High-speed video documentation of all critical zones
  • Time-lapse photography showing flow patterns over full shifts
  • Manual observation during peak and low-demand periods
  • Documentation of accumulation points and starvation zones
  • Identification of collision and jam locations

Flow Mapping Results: Create visual maps showing product density, velocity, and gap characteristics throughout the system. Bottleneck zones appear as high-density accumulation points with reduced downstream flow.

Step 3: Equipment Capacity Verification

Test individual components to verify actual vs. rated capacity:

  • Conveyor section speed and capacity testing
  • Merge point throughput measurement
  • Sortation system capacity validation
  • Transfer point efficiency analysis
  • Sensor and control system response time verification

Capacity Testing Reveals: Most conveyor system bottlenecks occur not because equipment can’t perform, but because system integration and control programming prevent equipment from operating at full capacity.

Step 4: Control System Audit

Comprehensive review of PLC programming and control logic:

  • Gap management algorithms and safety margins
  • Speed control programming and synchronization
  • Merge point control logic and prioritization
  • Sortation programming and decision logic
  • Error handling and recovery procedures
  • Sensor integration and data utilization

Control Audit Findings: In 73% of cases, control system programming creates artificial bottlenecks that can be fixed without equipment modifications.

Step 5: Root Cause Analysis

Synthesize all diagnostic data to identify true bottleneck causes:

  • Differentiate between capacity-limited and control-limited bottlenecks
  • Identify primary vs. secondary constraints
  • Calculate theoretical capacity improvements available
  • Prioritize bottlenecks by impact and fix difficulty
  • Develop comprehensive fix strategy

Phase 2: Solution Design and Engineering (Week 3-4)

Control System Optimization Design

For bottlenecks caused by programming limitations:

Intelligent Gap Management: Dynamic gap control algorithms that adjust spacing based on real-time conditions while maintaining safety.

Speed Synchronization: Coordinated speed control across all zones to eliminate gaps and maximize product density.

Predictive Routing: Advanced sortation logic that anticipates demand and pre-positions products for optimal flow.

Parallel Processing: Control architecture that handles multiple tasks simultaneously rather than sequentially.

Adaptive Performance: Self-tuning systems that automatically optimize parameters based on operational feedback.

Equipment Modification Design

For bottlenecks requiring physical changes:

Merge Point Upgrades: Enhanced merge control systems with dynamic prioritization and gap optimization.

Sortation Capacity Expansion: Additional sortation capacity or higher-speed sorters to eliminate capacity constraints.

Buffer Zone Implementation: Strategic accumulation areas that absorb flow variations and prevent upstream congestion.

Transfer Point Optimization: Improved transfer mechanisms that reduce gaps and increase effective capacity.

Sensor Enhancement: Additional sensors providing real-time data for intelligent control and optimization.

Simulation and Validation

Before implementation, validate solutions through comprehensive modeling:

  • Computer simulation of proposed changes
  • Capacity calculation and verification
  • Risk assessment and contingency planning
  • ROI analysis and financial justification
  • Implementation timeline and resource planning

Phase 3: Implementation and Optimization (Week 5-8)

Phased Implementation Approach

Strategic implementation that minimizes operational disruption:

Phase 3A – Control System Updates (Week 5-6):

  • Backup existing programming
  • Implement optimized control logic
  • Conduct controlled testing
  • Validate performance improvements
  • Fine-tune parameters

Phase 3B – Equipment Modifications (Week 7):

  • Install physical upgrades during scheduled downtime
  • Integrate new equipment with control systems
  • Conduct comprehensive testing
  • Validate capacity improvements
  • Document changes

Phase 3C – Final Optimization (Week 8):

  • Monitor performance under full production load
  • Fine-tune control parameters based on real data
  • Train operators on optimized system
  • Document best practices and procedures
  • Establish ongoing monitoring protocols

Performance Validation

Comprehensive testing to confirm bottlenecks are fixed:

  • Sustained capacity testing over multiple shifts
  • Peak demand stress testing
  • Product mix variation testing
  • Error recovery and exception handling validation
  • Long-term reliability verification

Common Conveyor System Bottleneck Types and Solutions

Understanding the most common bottleneck types helps facility managers quickly identify and fix conveyor system bottlenecks and delays in their operations.

Bottleneck Type 1: Merge Point Congestion

The Problem: Multiple conveyor lines converging create collision risks and capacity constraints. Conservative programming creates excessive gaps reducing throughput by 40-60%.

Symptoms:

  • Product accumulation on upstream lines
  • Intermittent flow through merge point
  • Large gaps between products downstream
  • System operating well below rated capacity
  • Frequent jams at merge points

The Solution to Fix This Bottleneck:

Intelligent Merge Control: Dynamic gap management that maintains minimum safe spacing while maximizing throughput:

  • Real-time product tracking on all incoming lines
  • Predictive positioning for optimal merge timing
  • Dynamic speed adjustment to create optimal gaps
  • Priority-based merge logic for different product types
  • Automatic adjustment for varying line utilization

Implementation Cost: $40,000-$80,000 for control system upgrades Capacity Improvement: 45-85% throughput increase at merge points Payback Period: 2-6 months depending on facility throughput value

Real-World Example: A distribution center with three lines merging to one was processing 4,200 cases/hour (35% of design capacity). Intelligent merge control implementation increased throughput to 9,800 cases/hour (82% capacity) with zero equipment changes. Investment: $52,000. Annual savings: $2.8 million. ROI: 5,385%.

Bottleneck Type 2: Sortation Capacity Constraints

The Problem: Sortation equipment cannot handle system throughput, creating upstream backup and system-wide capacity reduction.

Symptoms:

  • Continuous accumulation before sortation
  • Downstream conveyor sections running empty
  • Sortation system operating at maximum capacity
  • Overall system throughput limited to sortation capacity
  • Emergency shutdowns during peak demand

The Solution to Fix This Bottleneck:

Option A – Sortation Logic Optimization: If sortation equipment has unused capacity, optimize programming:

  • Parallel sort decision processing
  • Predictive routing reducing decision time
  • Optimized divert timing and positioning
  • Enhanced error recovery minimizing downtime
  • Dynamic capacity allocation based on demand

Implementation Cost: $60,000-$120,000 Capacity Improvement: 30-70% depending on current programming efficiency Payback Period: 3-8 months

Option B – Sortation Capacity Expansion: If equipment is at true capacity limits, add sortation capacity:

  • Additional sortation modules or lines
  • Higher-speed sortation technology
  • Parallel sortation for different product streams
  • Upstream pre-sorting to reduce main sorter load
  • Automated exception handling reducing manual intervention

Implementation Cost: $800,000-$2.4 million depending on solution Capacity Improvement: 100-300% sortation throughput increase Payback Period: 12-24 months

Real-World Example: An e-commerce fulfillment center limited to 12,000 packages/hour by sortation capacity implemented parallel sort logic optimization and added a secondary sortation line. Combined investment: $1.8 million. New capacity: 38,000 packages/hour (217% increase). Annual savings: $6.4 million. ROI: 356% over three years.

Bottleneck Type 3: Control System Speed Mismatches

The Problem: Different conveyor zones operating at incompatible speeds create gaps in product flow, dramatically reducing effective system capacity.

Symptoms:

  • Large gaps between products throughout system
  • Products appearing to “race” through some zones
  • Slow movement through other zones
  • Overall throughput significantly below theoretical maximum
  • Uneven product distribution across system

The Solution to Fix This Bottleneck:

Dynamic Speed Synchronization: Implement intelligent speed control that optimizes flow:

  • Real-time monitoring of product position throughout system
  • Automatic speed adjustment to minimize gaps
  • Zone-specific speed optimization based on product density
  • Predictive speed control anticipating flow changes
  • Continuous optimization based on operational patterns

Implementation Cost: $35,000-$70,000 for control system programming Capacity Improvement: 40-75% effective throughput increase Payback Period: 2-5 months

Real-World Example: A manufacturing facility with speed mismatches reducing capacity 58% implemented dynamic synchronization. Investment: $48,000. Throughput increased from 6,800 to 14,600 units/hour (215% improvement). Annual savings: $3.9 million. ROI: 8,125% first year.

Bottleneck Type 4: Manual Intervention Points

The Problem: Manual operations inserted into automated flow create inconsistent capacity and human-dependent bottlenecks.

Symptoms:

  • Throughput varying dramatically with staffing levels
  • Product accumulation before manual operations
  • Downstream starvation during breaks or shift changes
  • Capacity limited by human processing speed
  • Quality inconsistency from manual operations

The Solution to Fix This Bottleneck:

Automation of Manual Touchpoints: Eliminate human intervention from critical flow path:

  • Automated scanning and data capture replacing manual entry
  • Automated quality inspection replacing manual checks
  • Automated exception handling replacing manual intervention
  • Automated labeling and documentation replacing manual processes
  • Buffer systems absorbing human break periods

Implementation Cost: $150,000-$450,000 depending on automation scope Capacity Improvement: 200-400% at formerly manual points Payback Period: 8-16 months

Real-World Example: A distribution center with manual quality check bottleneck limiting capacity to 3,200 orders/hour automated inspection using vision systems and weight verification. Investment: $280,000. New capacity: 11,400 orders/hour (356% increase). Annual savings including labor reduction: $2.4 million. ROI: 857% over three years.

Bottleneck Type 5: Inadequate Buffer Capacity

The Problem: Insufficient accumulation zones prevent system from absorbing normal flow variations, causing shutdowns and reduced capacity.

Symptoms:

  • Frequent system shutdowns due to downstream issues
  • Inability to maintain consistent flow rates
  • Upstream equipment idle during downstream slowdowns
  • Product damage from start-stop operation
  • Operational inefficiency from constant adjustments

The Solution to Fix This Bottleneck:

Strategic Buffer Zone Implementation: Add intelligent accumulation capacity at critical points:

  • Dynamic accumulation zones that expand and contract with demand
  • Upstream buffering before constraint points
  • Downstream buffering before variable processes
  • Automated buffer management optimizing capacity utilization
  • Priority-based release from buffers during recovery

Implementation Cost: $120,000-$350,000 per buffer zone Capacity Improvement: 35-80% system reliability and uptime improvement Payback Period: 6-14 months

Real-World Example: A facility with frequent shutdowns reducing effective capacity 43% installed three strategic buffer zones. Investment: $420,000. Uptime improved from 68% to 96% (41% effective capacity increase from reduced downtime). Annual savings: $1.9 million. ROI: 452% over three years.

Advanced Diagnostic Techniques to Fix Conveyor System Bottlenecks

Modern diagnostic tools enable identification of bottlenecks that traditional analysis methods miss completely.

High-Speed Video Analysis

Professional video documentation reveals flow dynamics invisible to human observation:

Equipment Required:

  • High-speed cameras (240-480 fps)
  • Time-lapse recording capability
  • Multi-angle coverage of critical zones
  • Slow-motion playback and analysis software

Analysis Process:

  1. Record operations during various demand levels
  2. Analyze footage in slow motion identifying flow issues
  3. Measure actual gaps, speeds, and product density
  4. Compare to theoretical optimal performance
  5. Identify specific bottleneck causes and locations

Discoveries From Video Analysis:

  • Subtle timing issues creating cumulative gaps
  • Equipment synchronization problems
  • Control system response delays
  • Operator actions impacting flow
  • Product handling issues at transfer points

Computer Simulation Modeling

Advanced simulation enables testing bottleneck solutions before implementation:

Simulation Capabilities:

  • Model entire conveyor system with all components
  • Test various throughput scenarios and product mixes
  • Evaluate proposed solutions under different conditions
  • Identify secondary bottlenecks after primary fixes
  • Optimize control parameters before deployment

Simulation Benefits:

  • Zero-risk testing of solutions
  • Confidence in ROI projections
  • Identification of unintended consequences
  • Optimization of implementation sequence
  • Validation of capacity improvement claims

Real-World Application: A manufacturer considering $1.2 million in equipment upgrades to fix conveyor system bottlenecks used simulation to test alternatives. Simulation revealed control system optimization would achieve 85% of capacity improvement at 5% of the cost. Actual implementation confirmed simulation predictions.

Real-Time Performance Analytics

Continuous monitoring systems identify bottlenecks and delays as they develop:

Monitoring System Components:

  • Sensors throughout system tracking product flow
  • Real-time capacity utilization measurement
  • Bottleneck detection algorithms
  • Automated alerting for performance degradation
  • Predictive analytics identifying emerging issues

Analytics Benefits:

  • Immediate bottleneck identification
  • Trend analysis predicting future constraints
  • Performance comparison to baseline
  • Automatic optimization recommendations
  • Documentation for continuous improvement

Thermal Imaging for Mechanical Issues

Thermal cameras reveal mechanical problems creating bottlenecks:

Thermal Analysis Applications:

  • Bearing failures causing speed reductions
  • Motor overheating limiting capacity
  • Electrical issues affecting performance
  • Friction points reducing efficiency
  • Environmental factors impacting operations

Early Detection Benefits:

  • Prevent catastrophic failures
  • Address issues before they create bottlenecks
  • Optimize maintenance timing
  • Extend equipment life
  • Maintain consistent capacity

Financial Impact of Fixing Conveyor System Bottlenecks

Understanding the complete financial picture justifies investment to fix conveyor system bottlenecks and delays.

Direct Cost Savings

Labor Cost Reduction: Eliminating bottlenecks reduces labor requirements for manual workarounds and exception handling. Average savings: $400,000-$1.8 million annually for large facilities.

Overtime Elimination: Bottlenecks force overtime to meet demand. Fixing bottlenecks eliminates premium pay requirements. Average savings: $200,000-$900,000 annually.

Emergency Repair Costs: Bottlenecks create stress on equipment leading to failures. Optimization reduces maintenance costs. Average savings: $150,000-$600,000 annually.

Energy Efficiency: Optimized systems consume 20-35% less energy than bottleneck-constrained operations. Average savings: $80,000-$350,000 annually.

Revenue and Capacity Benefits

Increased Throughput: Primary benefit of fixing conveyor system bottlenecks is capacity increase enabling revenue growth. Average value: $2.4-$12.8 million annually depending on operation size.

Deferred Capital Investment: Optimizing existing systems defers expensive facility expansion. Average value: $5-15 million capital avoided.

Improved Service Levels: Consistent capacity enables reliable delivery promises improving customer retention. Average value: $800,000-$3.2 million annually.

Market Share Protection: Operational excellence prevents competitors from gaining advantage. Average value: Difficult to quantify but strategically critical.

Total Economic Impact

Comprehensive analysis of bottleneck elimination benefits:

Example Financial Model (Medium-sized distribution center):

  • Current bottleneck-limited capacity: 12,000 orders/day
  • Post-optimization capacity: 28,000 orders/day (233% increase)
  • Investment to fix conveyor system bottlenecks: $380,000
  • Annual revenue impact: $8.4 million (additional capacity)
  • Annual cost savings: $1.9 million (labor, overtime, efficiency)
  • Total annual benefit: $10.3 million
  • ROI: 2,711% first year
  • Payback period: 13.5 days

According to research from the Material Handling Institute, companies that systematically fix conveyor system bottlenecks and delays achieve average ROI of 400-800% over three years.

Taking Action to Fix Conveyor System Bottlenecks and Delays

Every day you operate with conveyor system bottlenecks and delays costs money while limiting growth potential. The competitive landscape demands immediate action to optimize operational capacity.

Lafayette Engineering has been helping companies fix conveyor system bottlenecks and delays for over 35 years. Our comprehensive diagnostic approach combines advanced engineering analysis with practical operational experience to identify and eliminate bottlenecks that other firms can’t find.

Our bottleneck elimination expertise includes control system optimization, equipment modifications, system integration, and comprehensive performance validation. We work closely with clients to understand their specific operational challenges and develop solutions that deliver guaranteed capacity improvements.

If you’re ready to fix conveyor system bottlenecks and delays limiting your operations, visit Lafayette Engineering to schedule a comprehensive bottleneck diagnostic with our team. We’ll assess your system performance, identify constraint points, and develop a complete optimization plan that delivers measurable capacity improvements.

Don’t let hidden bottlenecks continue limiting your capacity and profitability. The right diagnostic approach and optimization strategy can unlock 200-400% capacity improvements using your existing equipment, creating competitive advantages that drive sustainable growth.